LLM observability: tracing, cost and quality in production
We'll cover the following
Visual summary
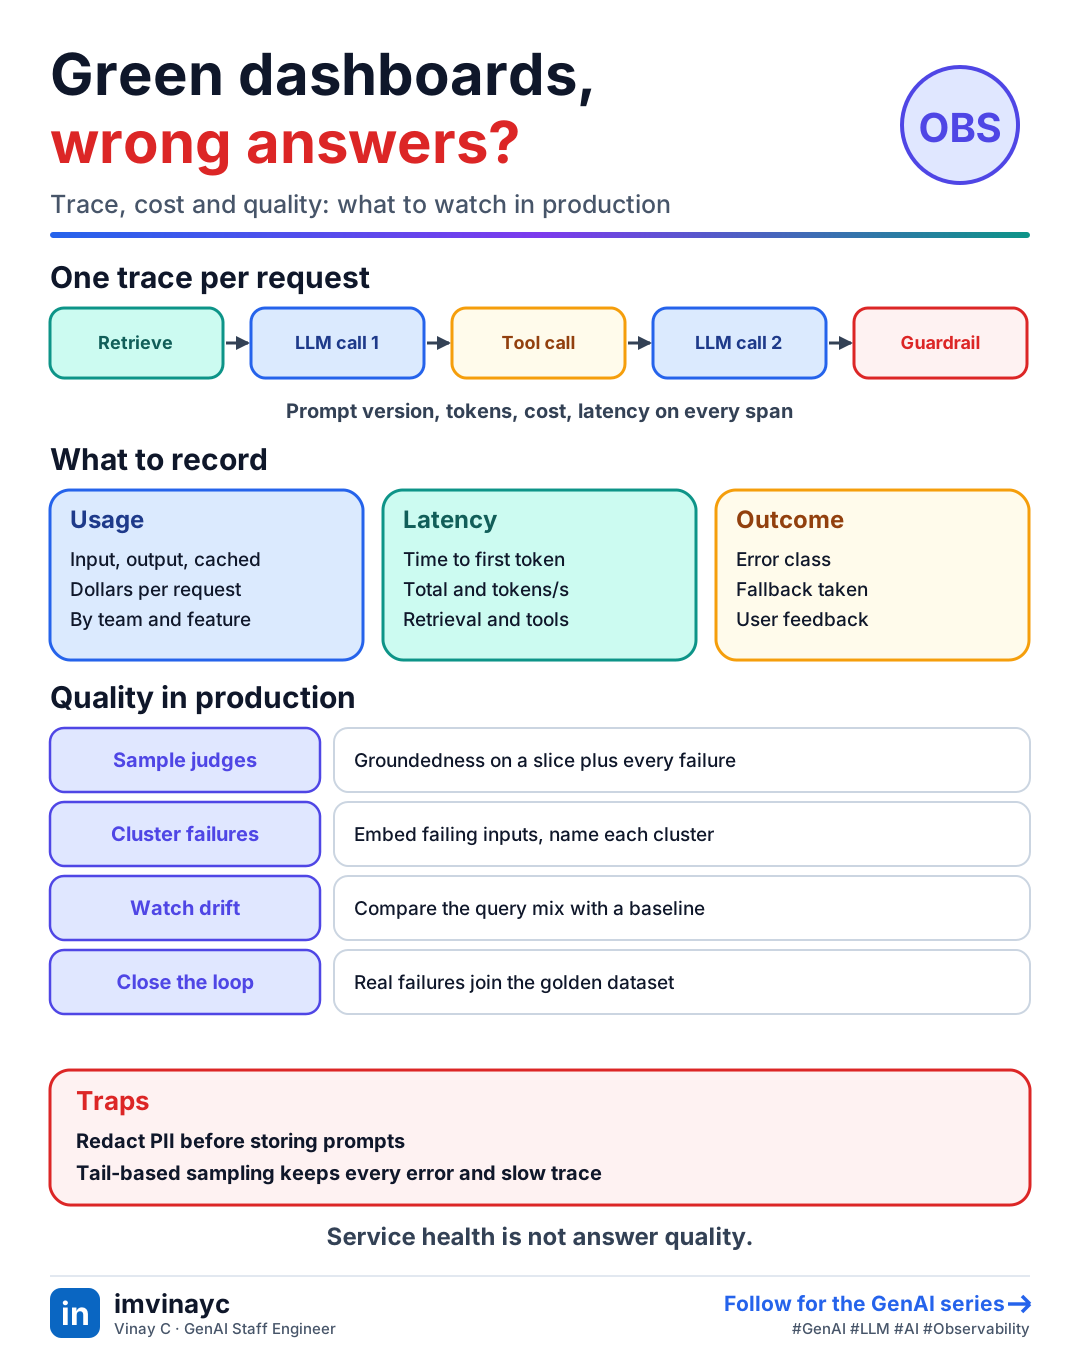
Download imageFree to share, please link back to this lesson.
Ordinary monitoring tells you the service is up and fast. It cannot tell you the answer was wrong. LLM observability adds three things on top: traces of every step (prompt, retrieval, tool calls), cost and token attribution, and quality signals measured on live traffic. Without them you debug a bad answer by guessing.
What to record for every request
- Identity and context: trace id, user or tenant, app, environment, prompt template name and version.
- Model call: model, parameters, input and output (after PII redaction), finish reason.
- Usage: input, output and cached tokens, and the computed cost.
- Latency: time to first token (TTFT), total time, tokens per second, and time spent in retrieval and each tool.
- Outcome: error class (429, 5xx, timeout, content filter, schema failure), fallback taken, user feedback.
Use OpenTelemetry spans so LLM traces join your normal distributed traces. OpenTelemetry has GenAI semantic conventions with attributes such as gen_ai.request.model and gen_ai.usage.input_tokens, still marked as evolving, so pin the version you use.
An agent run is a tree of spans
trace: support-agent request
  span: retrieve            (query, top-k ids, scores, 120 ms)
  span: llm.call #1         (prompt v7, 1,850 in / 90 out tokens, TTFT 410 ms)
  span: tool.lookup_order   (args, result size, 230 ms)
  span: llm.call #2         (3,100 in / 220 out, cost $0.011)
  span: guardrail.output    (passed)
The metrics that matter
| Group | Metrics |
|---|---|
| Latency | TTFT p50/p95/p99, total latency, tokens per second |
| Reliability | Error rate by class, retry and fallback rate, timeout rate |
| Cost | Tokens and dollars per team, per feature, per request; cache hit rate |
| Quality | Groundedness or faithfulness score, thumbs-down rate, escalation rate, task success |
| Safety | Guardrail block rate, injection attempts, PII hits |
Quality in production
You cannot judge every live request, so sample. Run an LLM judge or a groundedness check on a fraction of traffic plus every failure or low-feedback case, and chart the score over time like any other metric.
- Hallucination detection: check that each claim is supported by the retrieved context (judge or NLI model), verify that cited sources exist, and watch the share of answers with no citation.
- Failure-mode clustering: embed the inputs of failing traces, cluster them, and have an LLM name each cluster. You get "refund questions in Spanish fail" instead of a pile of examples.
- Input drift: compare this week's query distribution with a baseline (embedding centroids, topic mix, length, language). A new intent your prompts and evals never covered is the usual cause of a quality drop.
- Feedback loop: promote real failures into the golden dataset so the next release is tested against them.
Operational traps
- PII and secrets in logs: redact before storing, restrict who can read prompts, set retention. Logs of prompts are a privacy risk of their own.
- Volume and cost: full logging is large. Use head sampling for routine traffic and tail-based sampling to keep every error and slow trace.
- Alert on symptoms: p95 TTFT, error rate, spend per hour against budget, and a drop in groundedness, not on every single bad answer.
- Version everything: prompt, model and config version on each trace, otherwise you cannot tell which change caused a regression.
Build or buy
| Option | Good for |
|---|---|
| LangSmith, Langfuse, Arize Phoenix, Braintrust | Trace viewer, datasets, evals and prompt management out of the box |
| Datadog LLM Observability | Teams already on Datadog who want LLM traces beside infrastructure metrics |
| OpenTelemetry plus your own backend | Control, data residency, and one tracing system for everything |
Check yourselfDashboards are green (latency, errors) but users say answers got worse this week. What would you look at?
Quality signals, not service health: sampled groundedness scores, thumbs-down and escalation rate, and whether the input distribution drifted to intents the prompts and evals never covered. Also check what changed: prompt, model or retrieval index version on the traces. Cluster the failing inputs to find the pattern.
Check yourselfWhy use tail-based sampling for LLM traces?
Storing every prompt and response is expensive and a privacy risk. Tail-based sampling decides after the trace finishes, so you can keep every error, slow or low-score trace and only a small share of healthy ones.
Summary: say it in the interview
- "Every request gets a trace with prompt version, tokens, cost and latency, PII redacted. Quality comes from sampled judges plus all failures, drift is a query-distribution comparison, and failures feed the golden set."